I am using my ThinkPad X230 for some months now and I am very satisfied with it, it works fine, its performance for my everyday tasks is very good and I like the portability of the machine and that that battery lasts very long.
Lately I got my hands on a ThinkPad T520 and I was playing around with it, it is a big and heavy machine, its CPU is one generation older than mine and it has a dedicated NVIDIA NVS 4200M GPU in tandem with its internal Intel HD 3000.
My wife owns a W701 for some years now and abandoned it in favor of a T530p, so I got the chance to reinstall the machine and test it. It is equipped with 12 GB RAM (2x2GB + 2x4GB) in 4 banks, NVidia Quadro 2800M gpu with 1 GB, a Intel core i7-720qm CPU with 4 cores/8 threads and a display resolution of 1920×1200, a very powerful machine for its age!
So I decided to do a comparison between both machines because I like to compare things and wanted to share my results with you. Unfortunately the Intel HD 3000 and the Quadro FX 8200M do not support DirectX 11 so I had to skip the DirectX 11 tests and in some tests like e.g. 3DMark I could not get things working.
First of all here are the technical details of all machines:
ThinkPad W701
-
Intel Core i7–720QM CPU 1,6 – 2,8 GHz, 6 MB Cache, 4 cores / 8 threads
-
12 GB (2x2GB + 2x4GB) of Crucial PC3-10700 RAM in a dual channel configuration.
-
Windows 10 Professional 64 Bit
-
NVidia Quadro 2800M driver version: 9.18.13.4181 (NVidia version 341.81)
ThinkPad X230
-
Intel Core i5-3320M CPU 2,6 – 3,3 GHz, 3MB cache, 2 cores / 4 threads
-
8 GB (4 + 4) of Crucial PC3-12800 RAM in a dual channel configuration.
-
Windows 10 Professional 64 Bit
-
Intel HD 4000 driver version: 10.18.10.4276
ThinkPad T520
-
Intel Core i5-2410M CPU with 2,3 – 2,9 GHz, 3MB cache, 2 cores / 4 threads
-
10 GB (8 + 2) of PC3-10700 RAM in a dual channel configuration.
-
Windows 10 Professional 64 Bit
-
Intel HD 3000 driver version: 9.17.10.4229
-
NVidia NVS 4200M driver: 10.18.13.5362 (NVidia Version: 353.62)
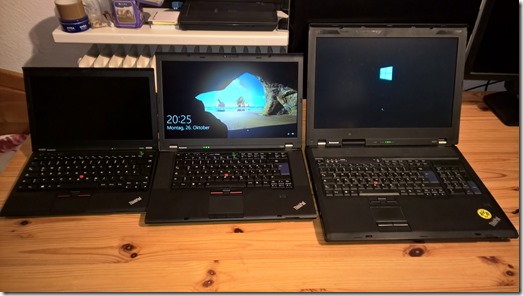
Here is a photo of all three contestants next to each other (to the left the X230, in the middle the T520 and to the right the W701):
The results show that the Intel HD 4000 is very capable and in most cases faster than the discrete NVidia NVS 420M card! The least capable card is, as was to be expected, the Intel HD 3000.
To my surprise the dual core / 4 thread CPU of the X230 is more capable than the quad core / 8 thread CPU of the W701 which should be because of three CPU generations between both CPUs and the fact that the Core i7-720QM is lower clocked than the Core i5-3320M CPU (1,6- 2,8GHz versus 2,6 – 3,3 GHz)! You can see this in the single and multi core results in Geekbench where the Core i5-3320M wins by a big margin. Also Cinebench shows that this CPU is the clear winner in single and multicore! The high single core results make this CPU a good candidate for playing console emulators like the Dolphin emulator.
Graphicswise the W701 wins with big distance to the other competitors, this old GPU is still very capable for gaming and for graphics intensive work.
|
Test |
X230 |
T520 |
T520 |
W701 |
|
Geekbench 3.3.2 Single Core |
2707 |
2131 |
2131 |
1642 |
|
Geekbench 3.3.2 Multi Core |
5757 |
4603 |
4603 |
4404 |
|
Cinebench R15 OpenGL |
19,14 fps |
10,78 fps |
– |
31,8 fps |
|
Cinebench R15 CPU |
272 cb |
225 cb |
225 cb |
231 cb |
|
Cinebench R15 CPU Single Core |
108 cb |
77 cb |
77 cb |
66 cb |
|
Unigine Heaven 4 (1366×768,high) |
12,3 fps |
8,6 fps |
7,1 fps |
22,8 fps |
|
Unigine Heaven 4 (1920×180,high) |
6,2 fps |
4,3 fps |
3,7 fps |
12,6 fps |
|
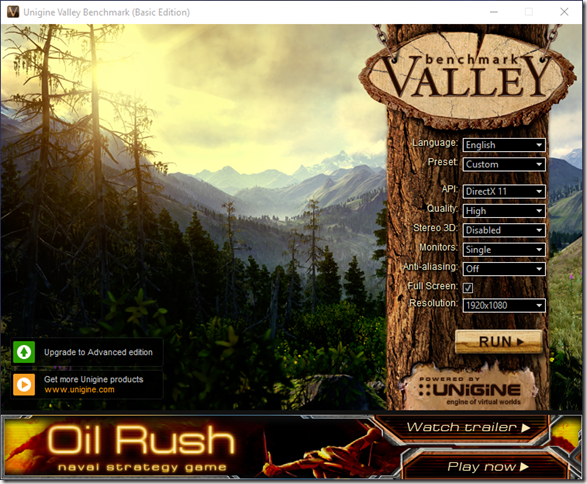
Unigine Valley 1.0 (1366×768,high) |
10,3 |
9,9 fps |
5,6 fps |
17,6 fps |
|
Unigine Valley 1.0 (1920×180,high) |
6,4 fps |
5,6 fps |
3,3 fps |
11,6 fps |
|
Resident Evil 5 Test 1 (1368×768), AA off, DX10 |
40,2 fps |
38 fps |
23,9 fps |
79,8 |
|
Resident Evil 5 Test 1 (1920×1080), AA off, DX10 |
24,1 fps |
22,5 fps |
14,4 fps |
57,1 fps |
|
Resident Evil 5 Test 2 (1368×768), AA off, DX10 |
34,9 fps |
32,2 fps |
17,2 fps |
54,1 fps |
|
Resident Evil 5 Test 2 (1920×1080), AA off, DX10 |
19 fps |
19,9 fps |
12,9 fps |
47,2 fps |
|
Final Fantasy XIV – 1368×768, DX11, Notebook(high) |
1857 |
1380 |
– |
– |
|
Final Fantasy XIV – 1920×1080, DX11, Notebook(high) |
816 | 740 |
– |
– – |
|
Final Fantasy XIV – 1368×768, DX10, Notebook(high) |
1910 |
2035 |
1199 |
4934 |
|
Final Fantasy XIV – 1920×1080, DX10, Notebook(high) |
1112 |
1216 |
687 |
3144 |
|
3DMark 11 |
715 |
688 |
– |
– |
|
3DMark – Fire Strike 1.1 |
552 |
403 |
– |
– |
|
3DMark – Sky Diver 1.0 |
2013 |
1460 |
– |
– |
|
3DMark – Cloud Gate 1.1 |
4426 |
2910 |
– |
– |
|
3DMark – Ice Storm 1.2 |
49678 |
27459 |
– |
– |
|
Half Life 2 – Lost Coast (1368×768, DX9) |
193,2 fps |
138,4 fps |
75 fps |
218,6 fps |
|
Half Life 2 – Lost Coast (1920×1080, DX9) |
83,3 fps |
83,8 fps |
41,5 fps |
197,5 fps |
|
Tomb Raider(1366×768) |
37,3 fps |
33,3 fps |
22,8 fps |
85,8 fps |
|
Tomb Raider(1920×1080) |
20,9 fps |
18,0 fps |
11,2 fps |
48,8 fps |
|
Stalker DX10, 1368×768, high preset – day |
27,0 fps |
27,0 fps |
16 |
70 |
|
Stalker DX10, 1368×768, high preset – night |
28,0 fps |
23,0 fps |
15 |
66 |
|
Stalker DX10, 1368×768, high preset – rain |
30,0 fps |
25,0 fps |
17 |
73 |
|
Stalker DX10, 1368×768, high preset – sun shafts |
14,0 fps |
14 0 fps |
7 |
33 |
|
Stalker DX10, 1920×1080, high preset – day |
17 fps | 16 fps | 10 |
46 |
|
Stalker DX10, 1920×1080, high preset – night |
16 fps | 13 fps | 8 |
41 |
|
Stalker DX10, 1920×1080, high preset – rain |
17 fps | 14 fps | 9 |
43 |
|
Stalker DX10, 1920×1080, high preset – sun shafts |
8 fps | 7 fps | 3 |
19 |
|
Stalker DX11, 1368×768, high preset – day |
26,0 fps |
27,0 fps |
– | |
|
Stalker DX11, 1368×768, high preset – night |
27,0 fps |
26,0 fps |
– | |
|
Stalker DX11, 1368×768, high preset – rain |
31,0 fps |
28,0 fps |
– | |
|
Stalker DX11, 1368×768, high preset – sun shafts |
13,0 fps |
12, 0 fps |
– | |
|
Stalker DX11, 1920×1080, high preset – day |
15 fps | 16 fps | – | |
|
Stalker DX11, 1920×1080, high preset – night |
15 fps | 14 fps | – | |
|
Stalker DX11, 1920×1080, high preset – rain |
16 fps | 15 fps | – | |
|
Stalker DX11, 1920×1080, high preset – sun shafts |
7 fps | 7 fps | – | |
|
Street Fighter 4, 4xAA – 1368×768 |
5089 |
5872 |
4322 |
8339 |
|
Street Fighter 4, 4xAA, 1920×1080 |
3932 |
4541 |
3579 |
6309 |
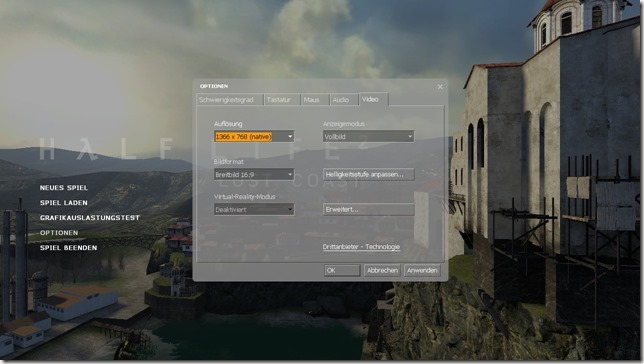
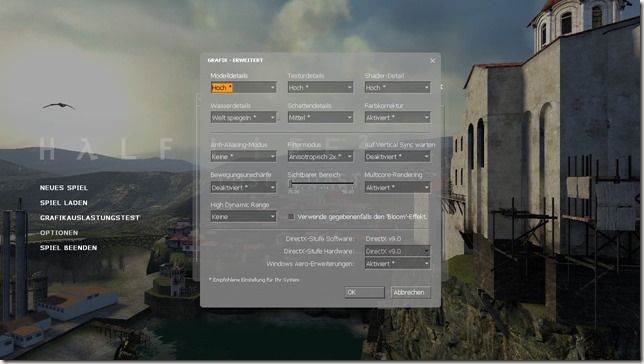
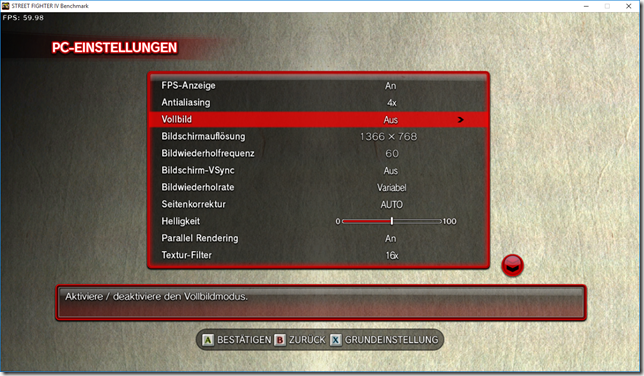
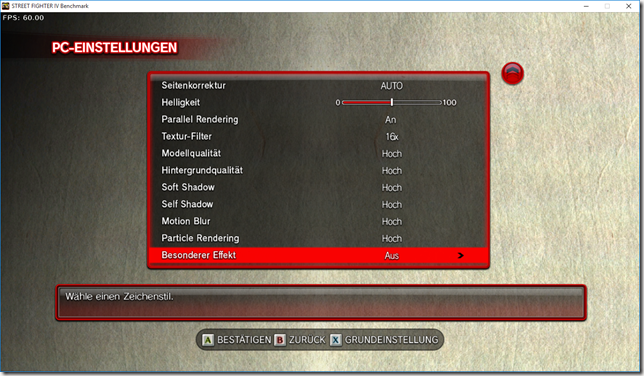
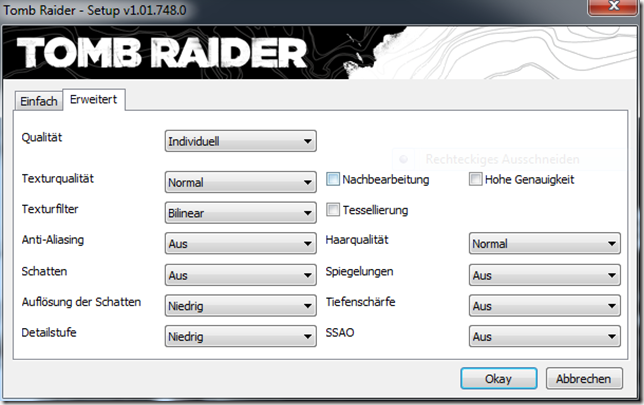
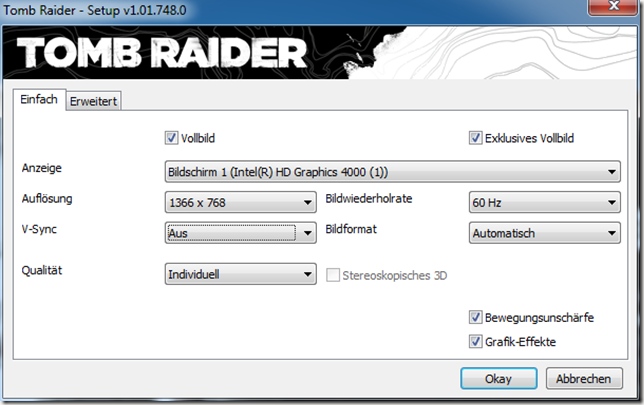
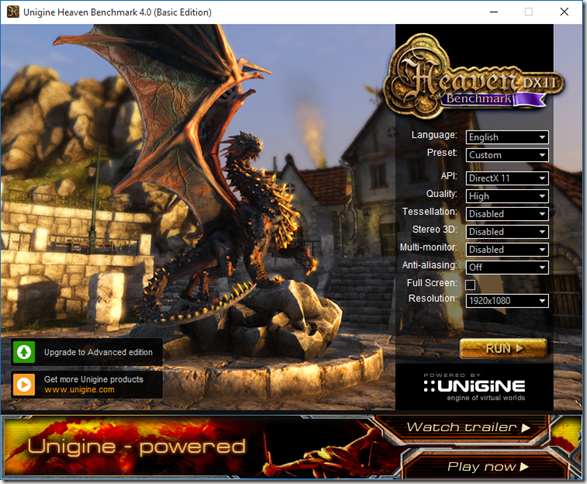
Here are the settings for the different benchmarks:


